Visualize with QuickSight using Athena
In this lab, we will build an Amazon QuickSight Dashboard that uses Amazon Athena to access data.
Important
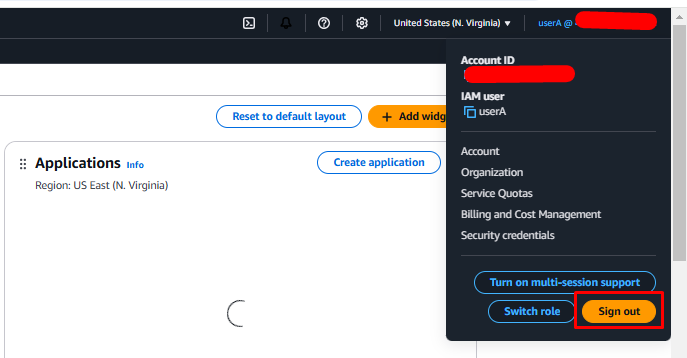
Before setting up QuickSight, we need to log out of AWS and log back in with a user that has the appropriate permissions.
To log out:
- Click the username in the top right-hand corner of the page.
- Click the Sign Out button.
Log back into your AWS Console as an IAM user that has permissions to set up QuickSight.
Log back into your AWS Console as an IAM user that has permissions to set up QuickSight.
Set up QuickSight
Once logged back in, follow these steps to set up Amazon QuickSight:
-
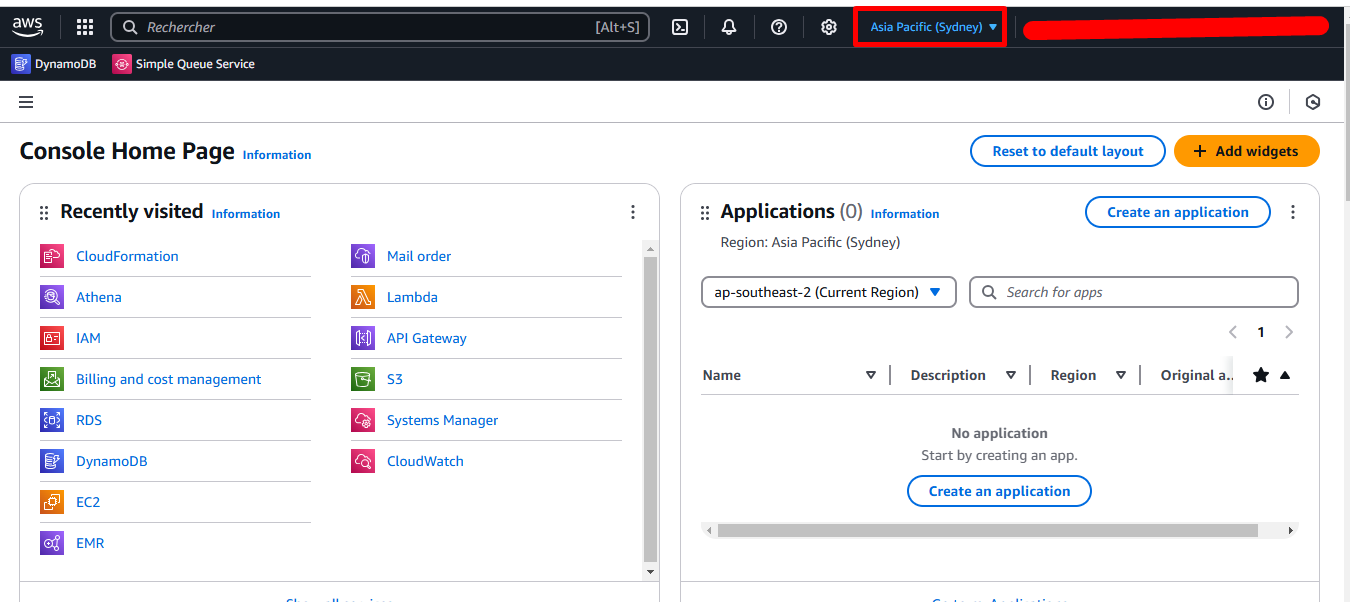
Take note of the AWS Region where you are running the lab. This is shown in the top menu bar.
-
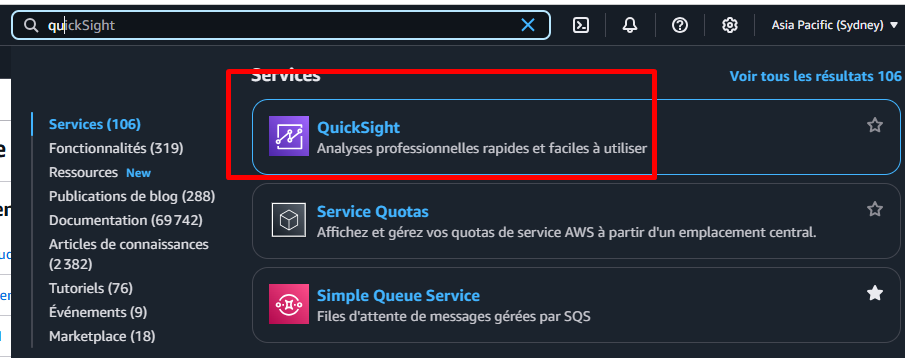
Search for QuickSight in the AWS search bar and select QuickSight from the results. This will take you to the QuickSight landing page.
-
If your AWS account is not signed up for QuickSight, click Sign up for QuickSight.

-
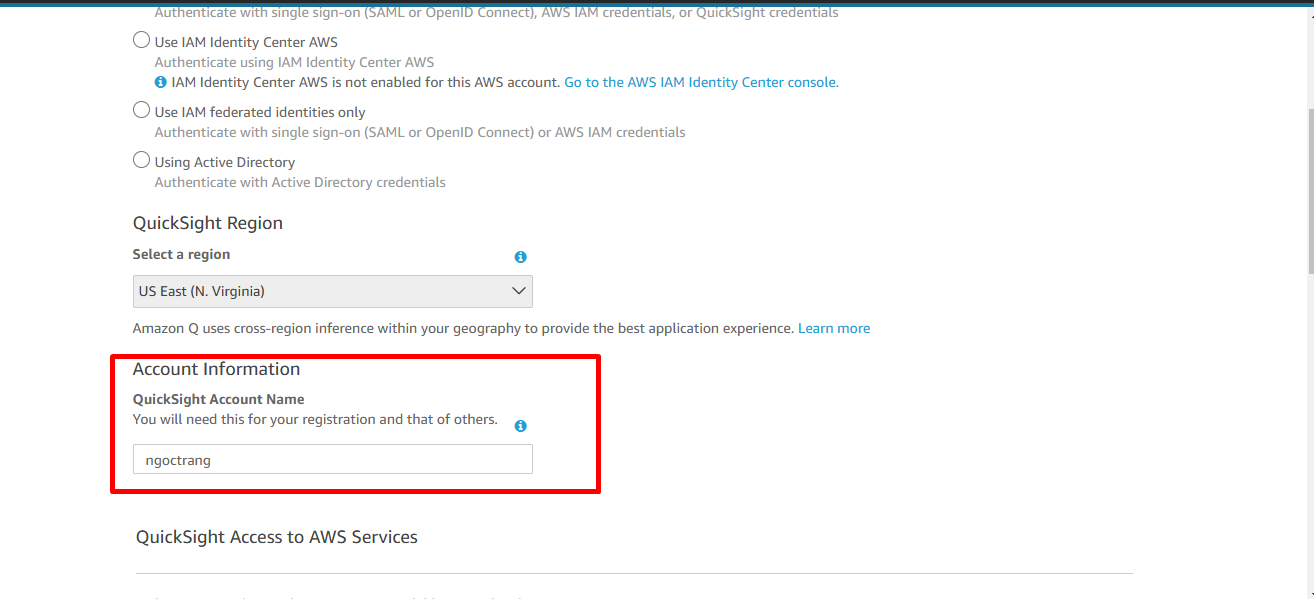
On the Sign Up for QuickSight screen, complete the following fields:
- Email for Account Notifications: Enter an email address.
- QuickSight Region: Choose the region matching your lab setup.
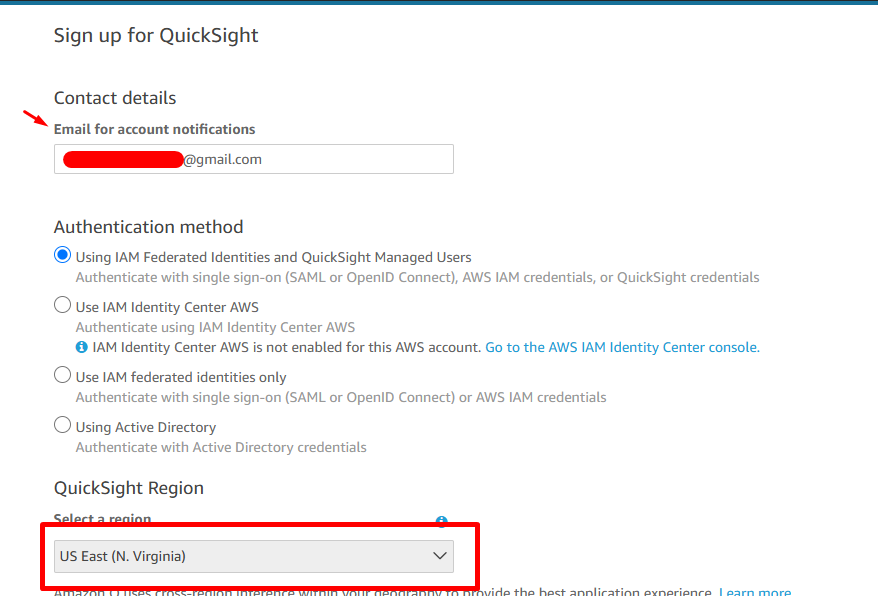
- QuickSight Account Name: Enter a unique name (only letters, numbers, and dashes are allowed).
-
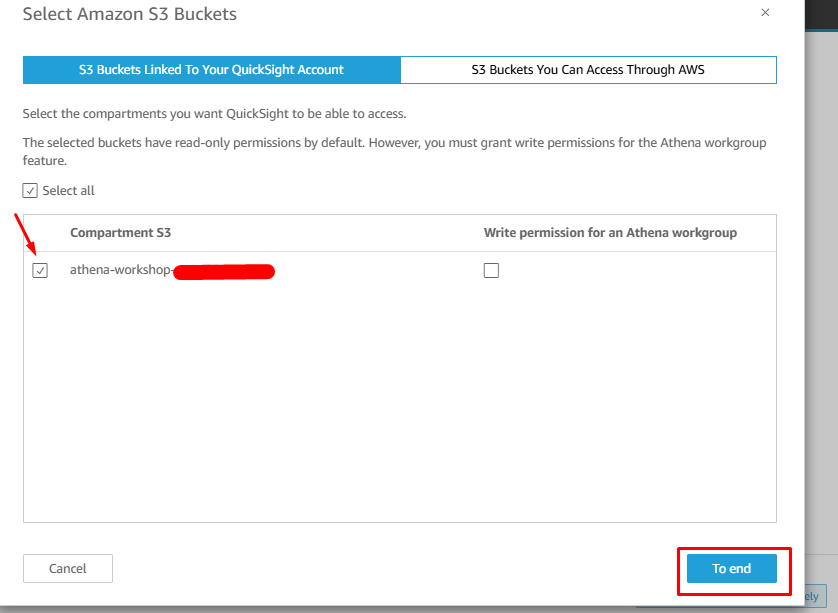
In the QuickSight Access to AWS Services section:
- Check Amazon Athena.
- Check Amazon S3 (A popup will appear to select S3 buckets). Click Select All, then Finish.
-
In the Optional Add-On section, uncheck “Add Pixel-Perfect reports”.
-
Click the Finish button.
-
Once completed, you should see an Account created successfully message.
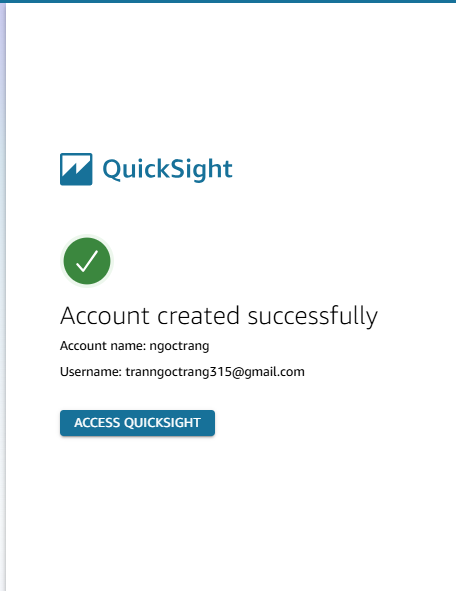
-
Click Go to QuickSight to load QuickSight.
Create a QuickSight Dataset
We will create a new dataset for our QuickSight dashboard that connects to a table in Athena.
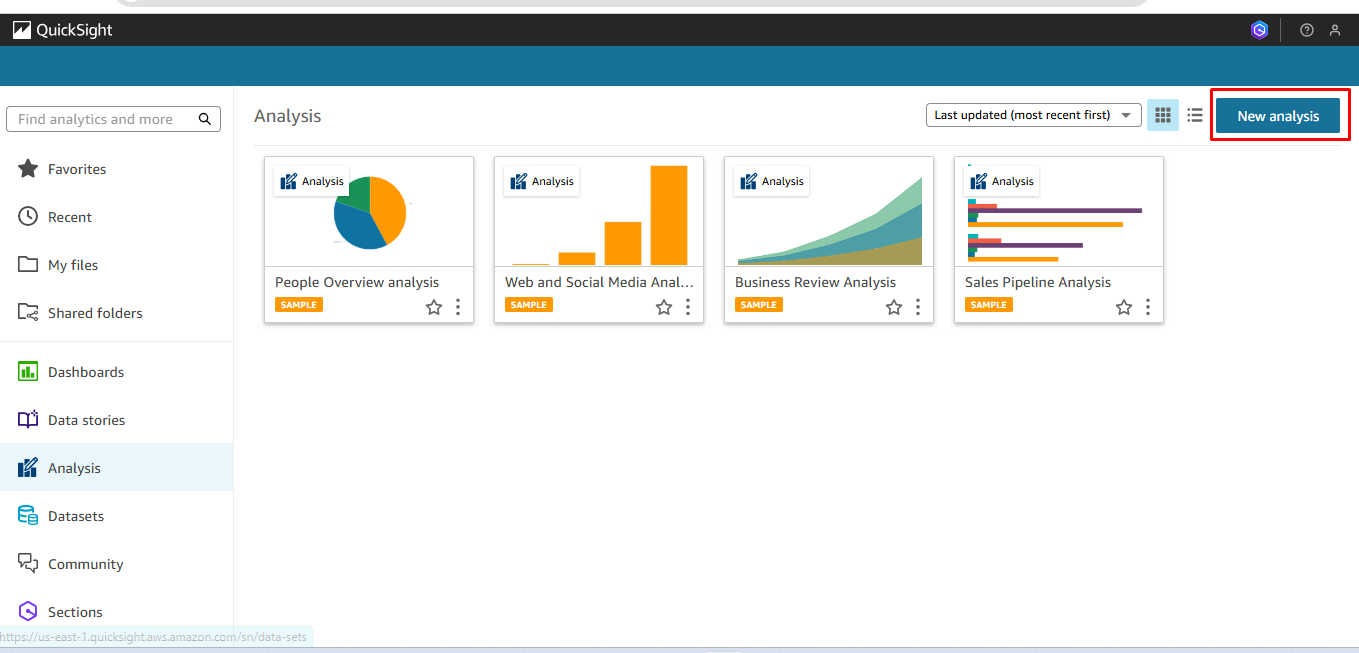
-
Click New Analysis (top right corner).
-
Click New dataset (top left corner).
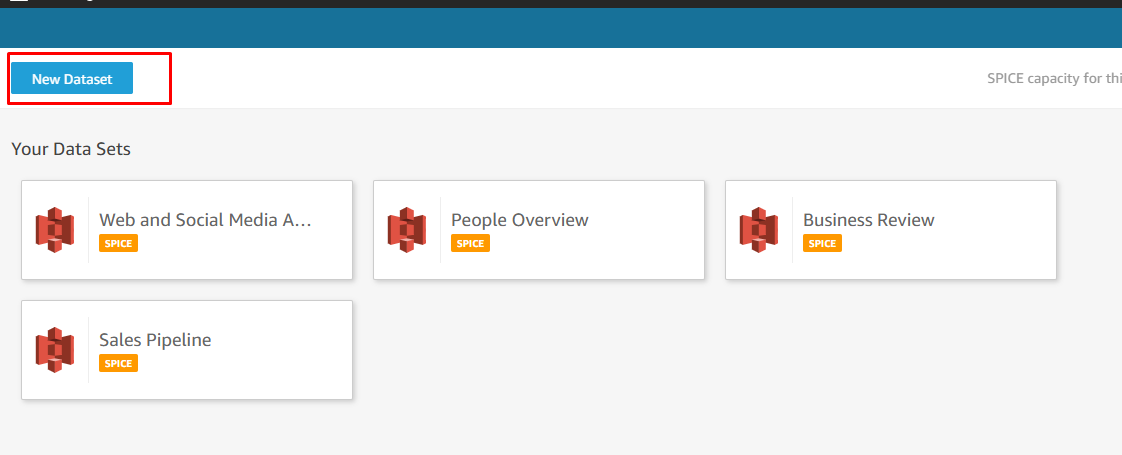
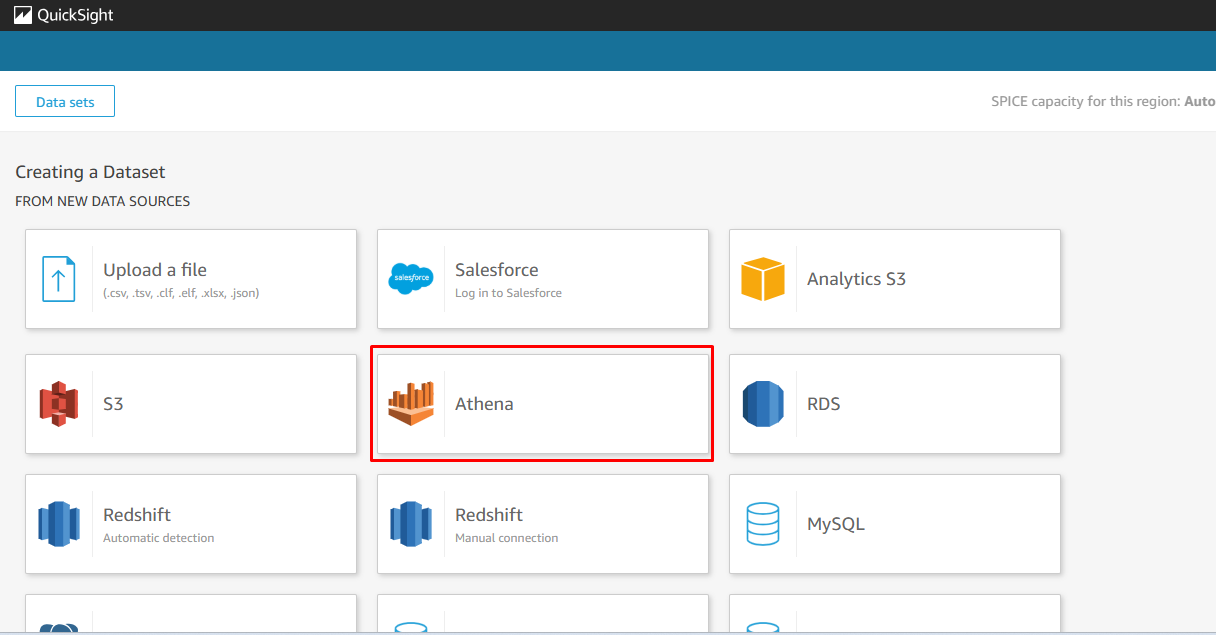
-
Locate the Athena icon and click it.
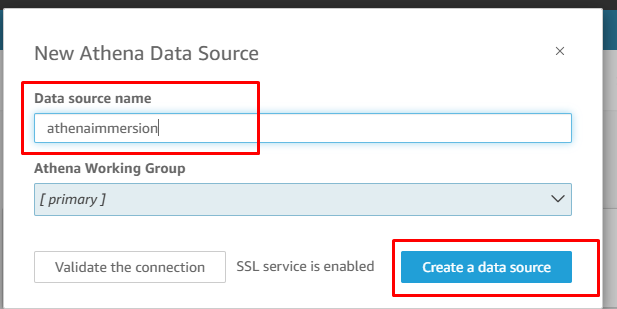
-
For Data source name, type
athenaimmersionand click Create Data Source.
-
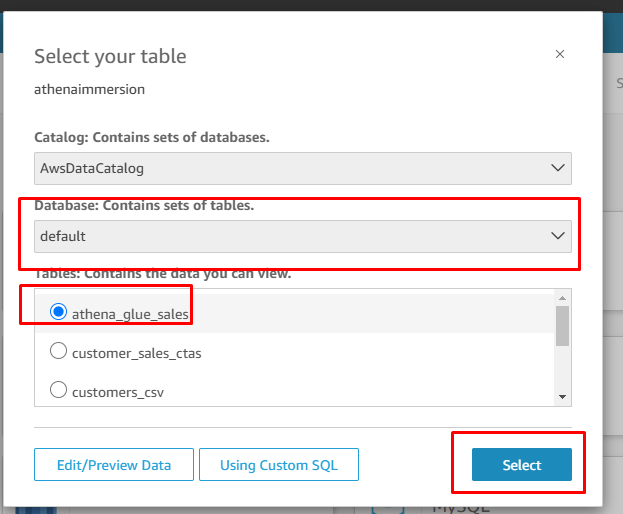
On the next screen, select the
defaultdatabase and chooseathena_glue_saletable. Click Select.
-
On the finish data set creation screen, choose Query your data directly and click Visualize.
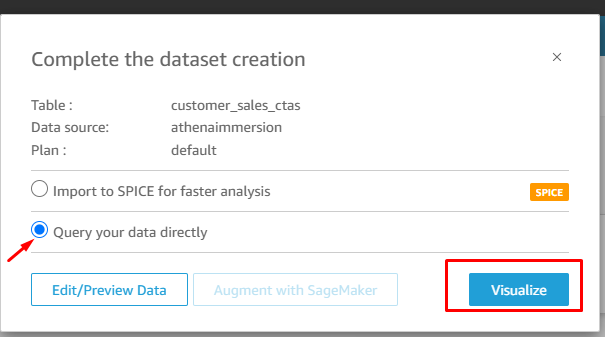
-
You will now see the QuickSight analysis editor.
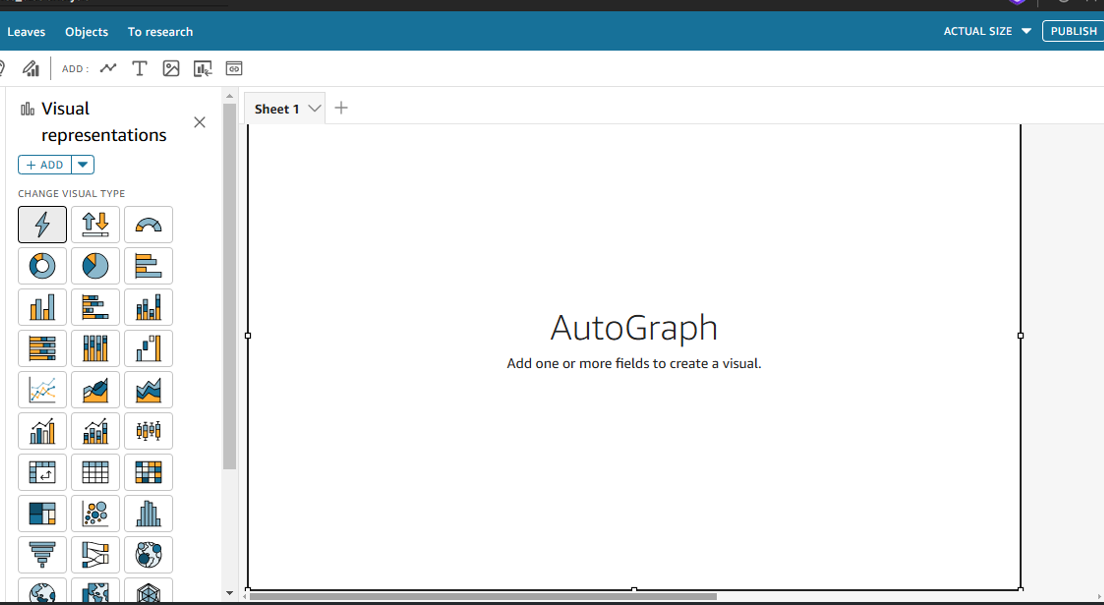
Create QuickSight Charts
We will create a simple analysis using our price dataset.
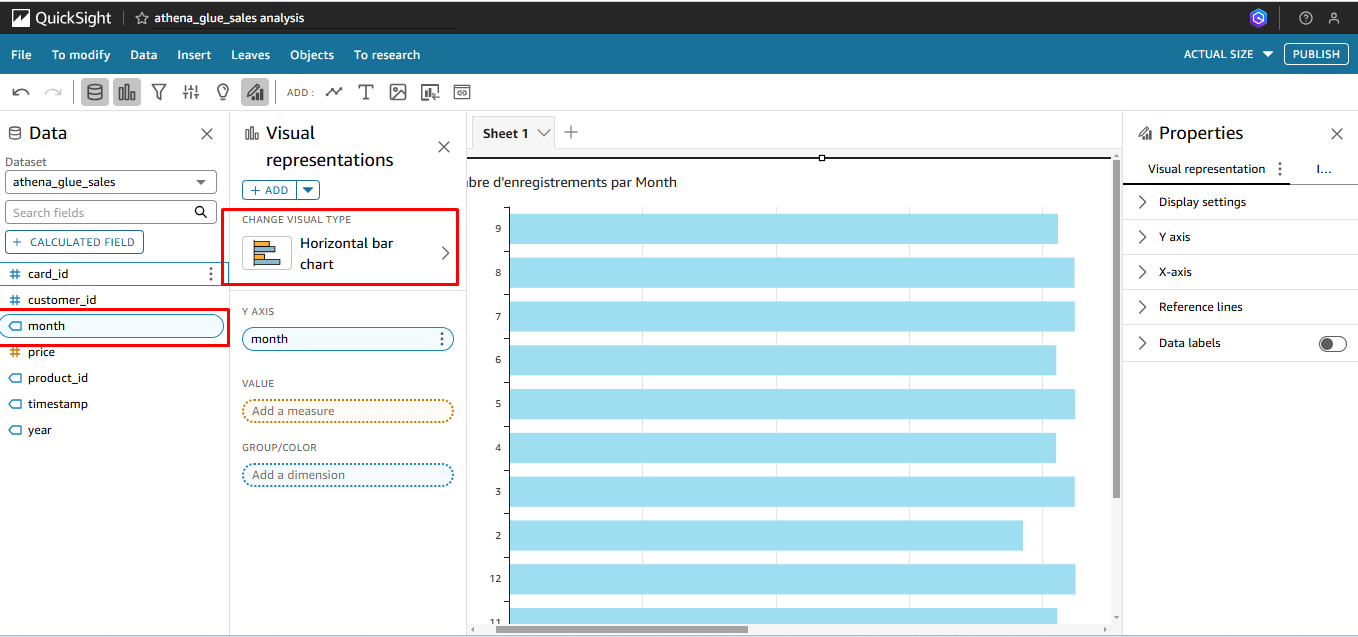
Create a Bar Chart
- From Fields List, drag the
monthfield onto AutoGraph. - QuickSight will automatically select a Horizontal Bar Chart displaying count of price records by month.
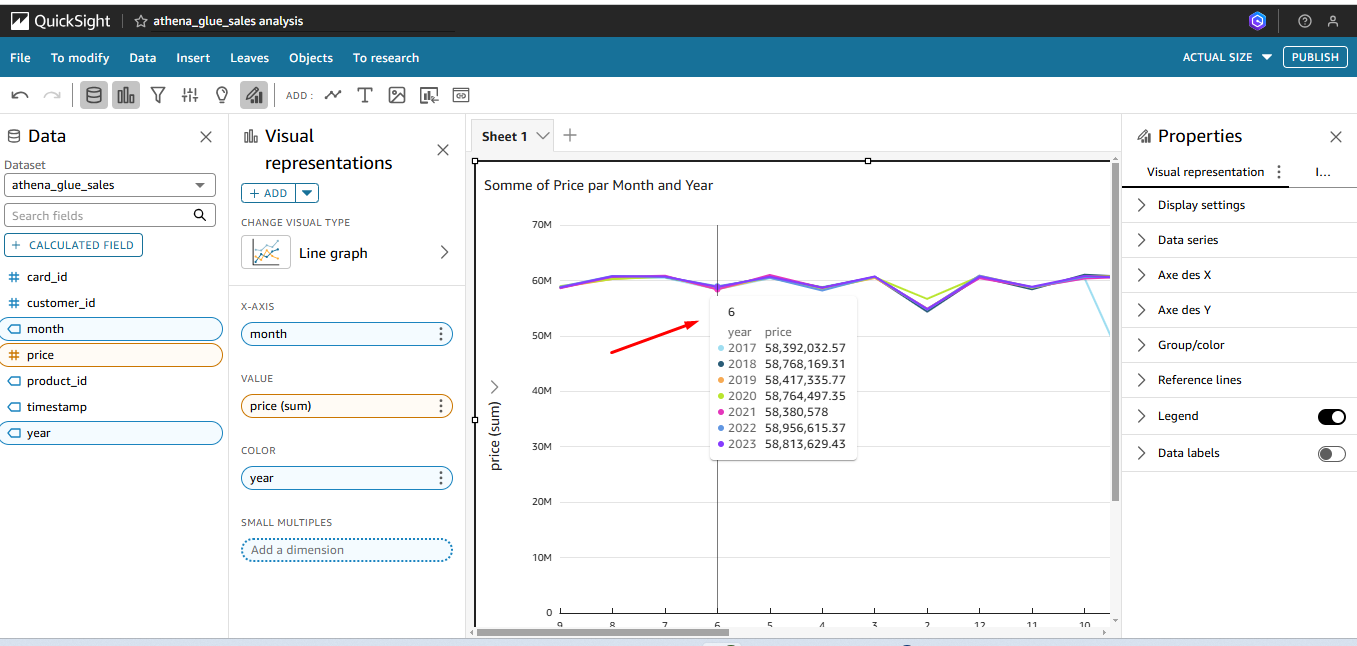
Create a Line Chart
-
Click in the grey space below the existing Bar Chart.
-
Set the Value as
month, and the Color asyear.
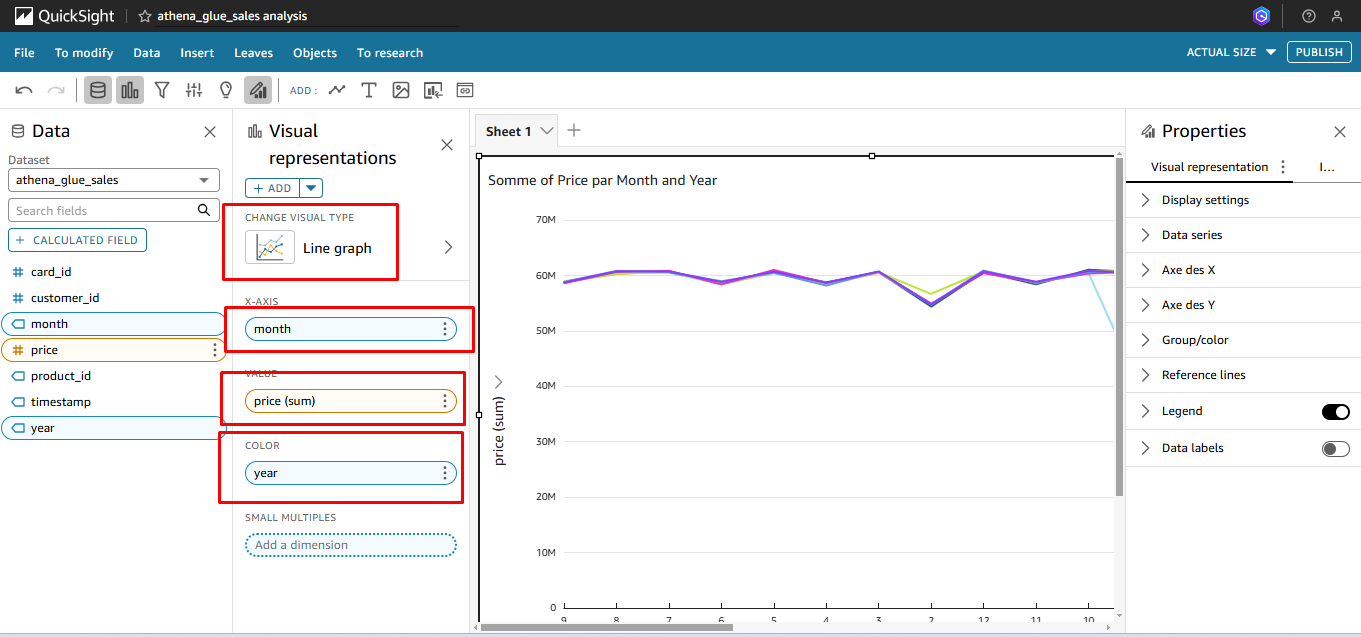
-
The chart will display the data as shown below:
-
Repeat this process to display the data for price by month and year.
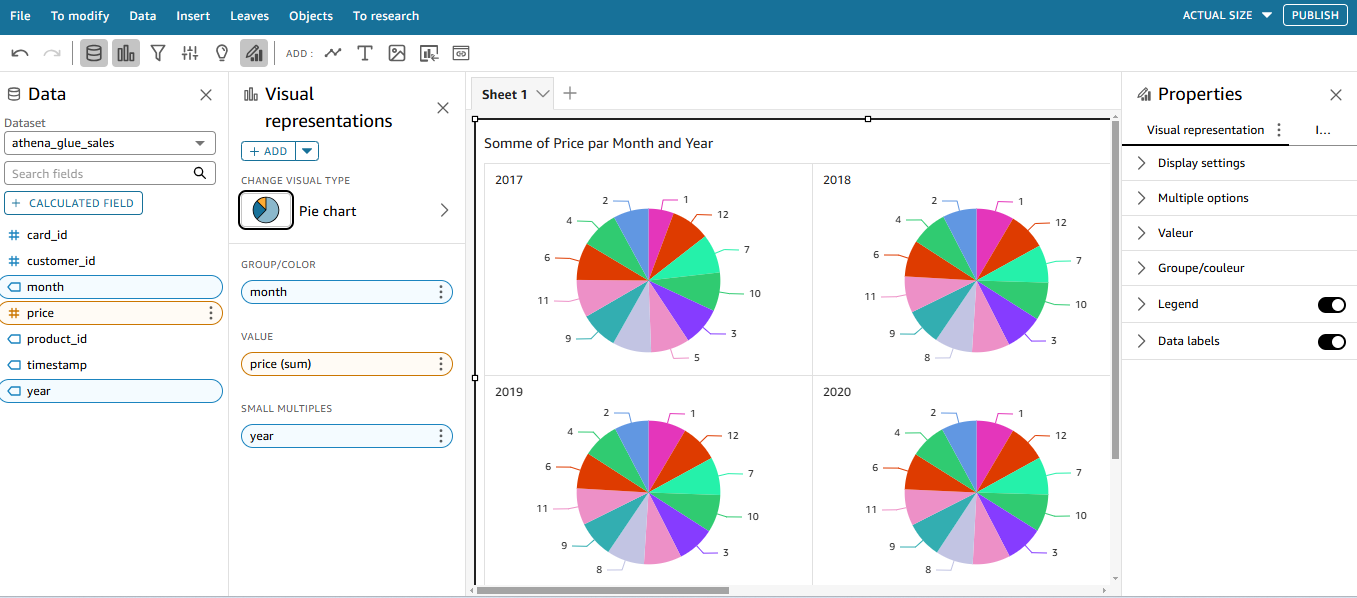
-
Try changing the chart type and settings as desired.
Conclusion
You have successfully used Amazon QuickSight to connect to your data via Amazon Athena and created a visual analysis.